Analysis cost by Cost Explorer service
1. Cost Explorer helps you track expenses - how detailed?
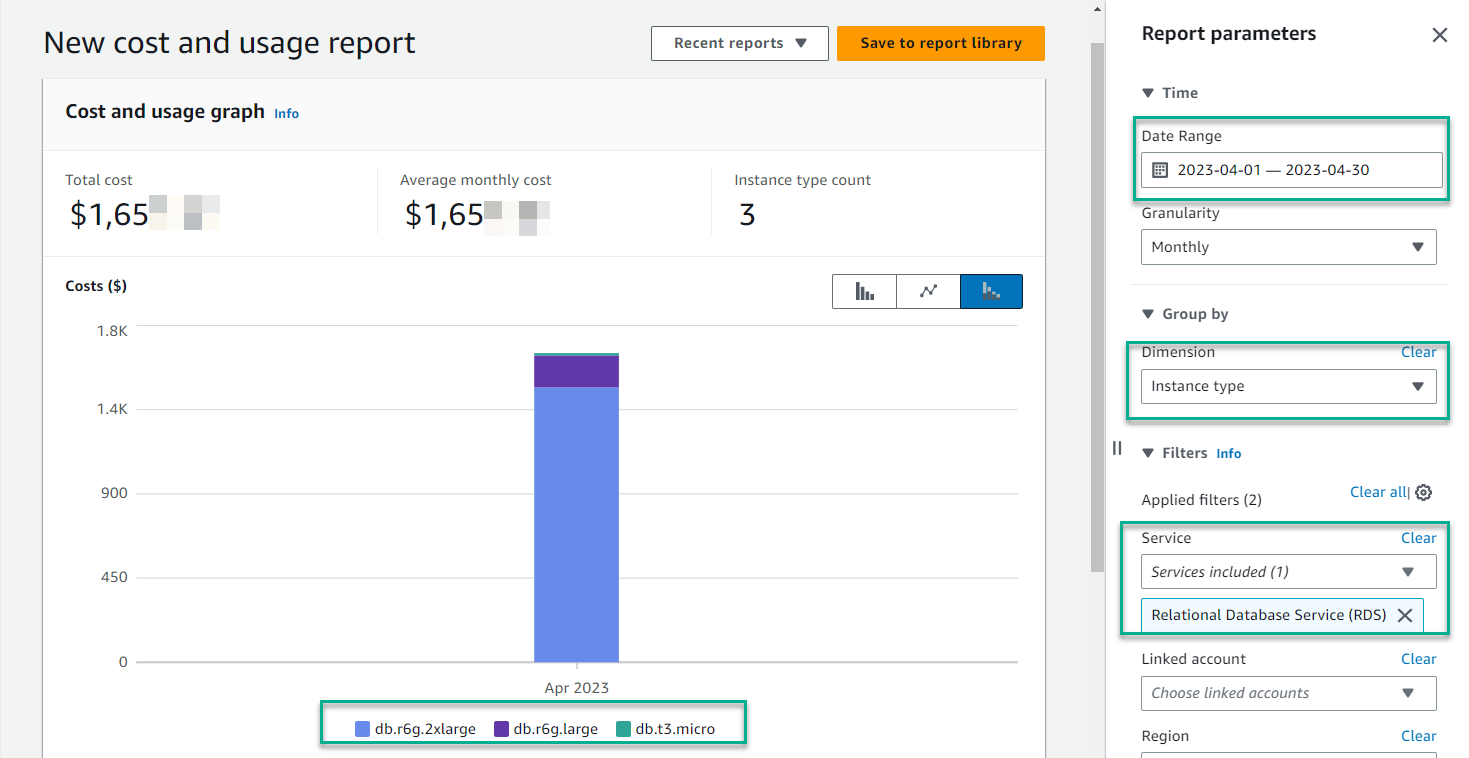
Once you’ve gone through steps 1,2 and 4 - you’ve experienced the convenience of AWS Cost Explorer: with an easy-to-use interface that helps you understand and manage your costs and your AWS usage over time. In addition, AWS Cost Explorer provides default or custom reports for cost and usage data analysis. Your cost breakdown goes down to service and resource level e.g. RDS instance type
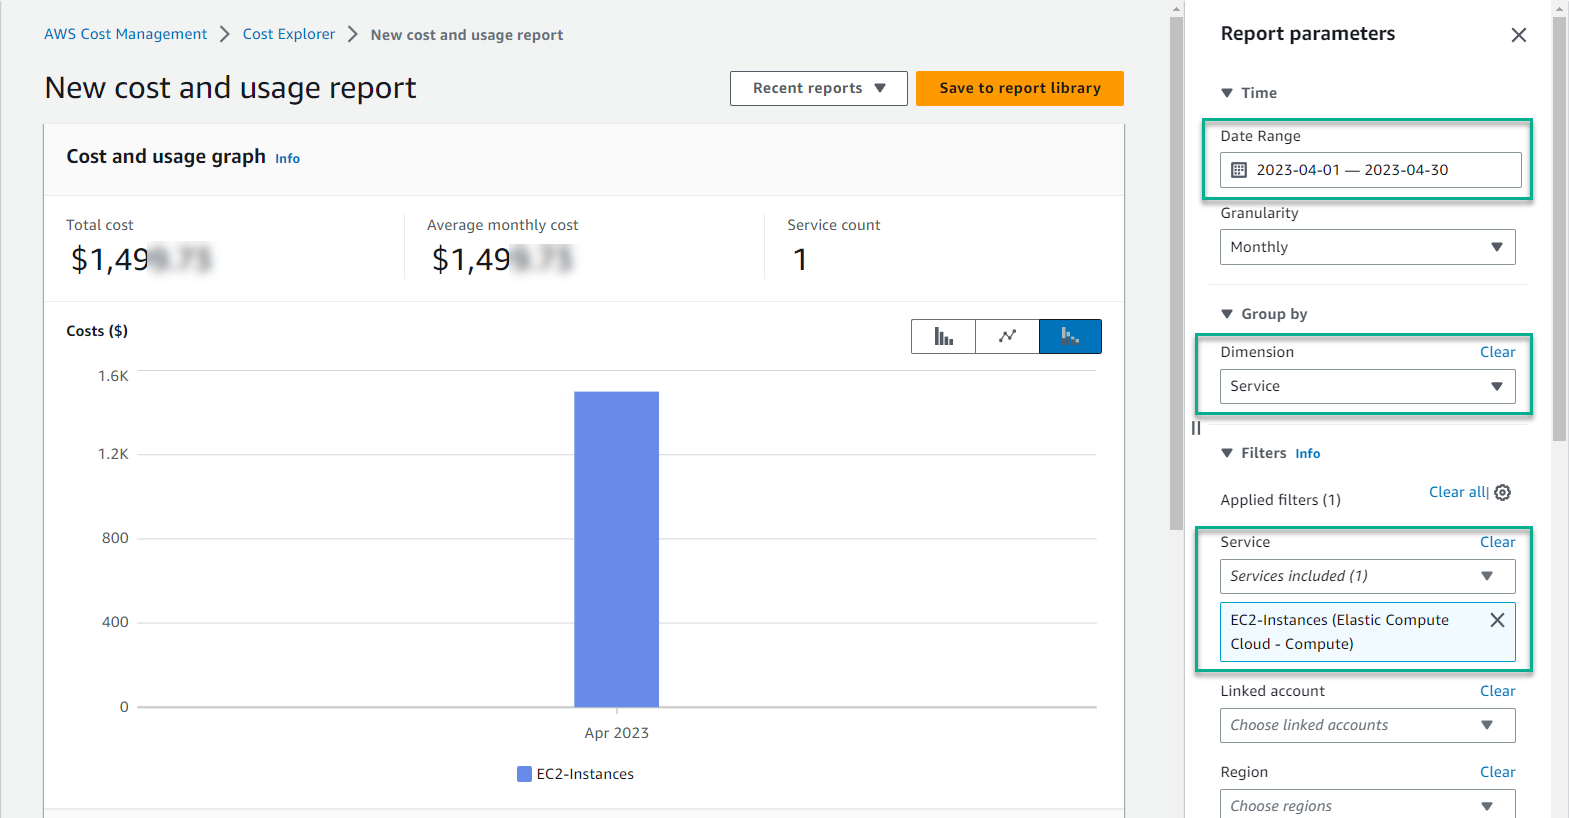
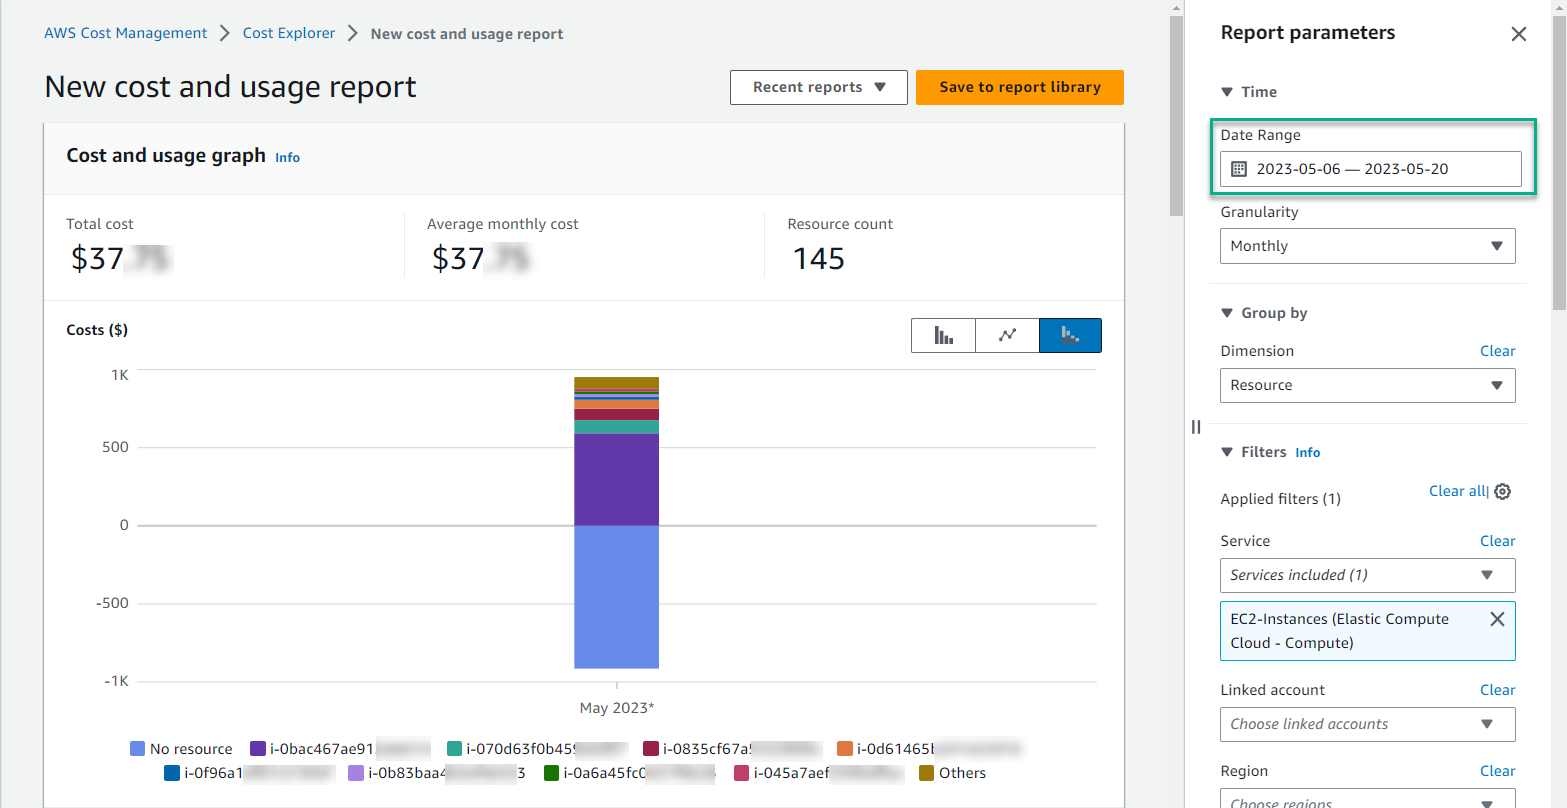
In addition, AWS Cost Explorer also supports resource analysis: EC2 with high granularity eg: EC2 - Instance ID, however, only supported within the last 14 days - from the present time. For example: you are choosing
- Date Range: in April
- Dimension : Service
- Service : EC2-Instance
-> You can update the result as shown below
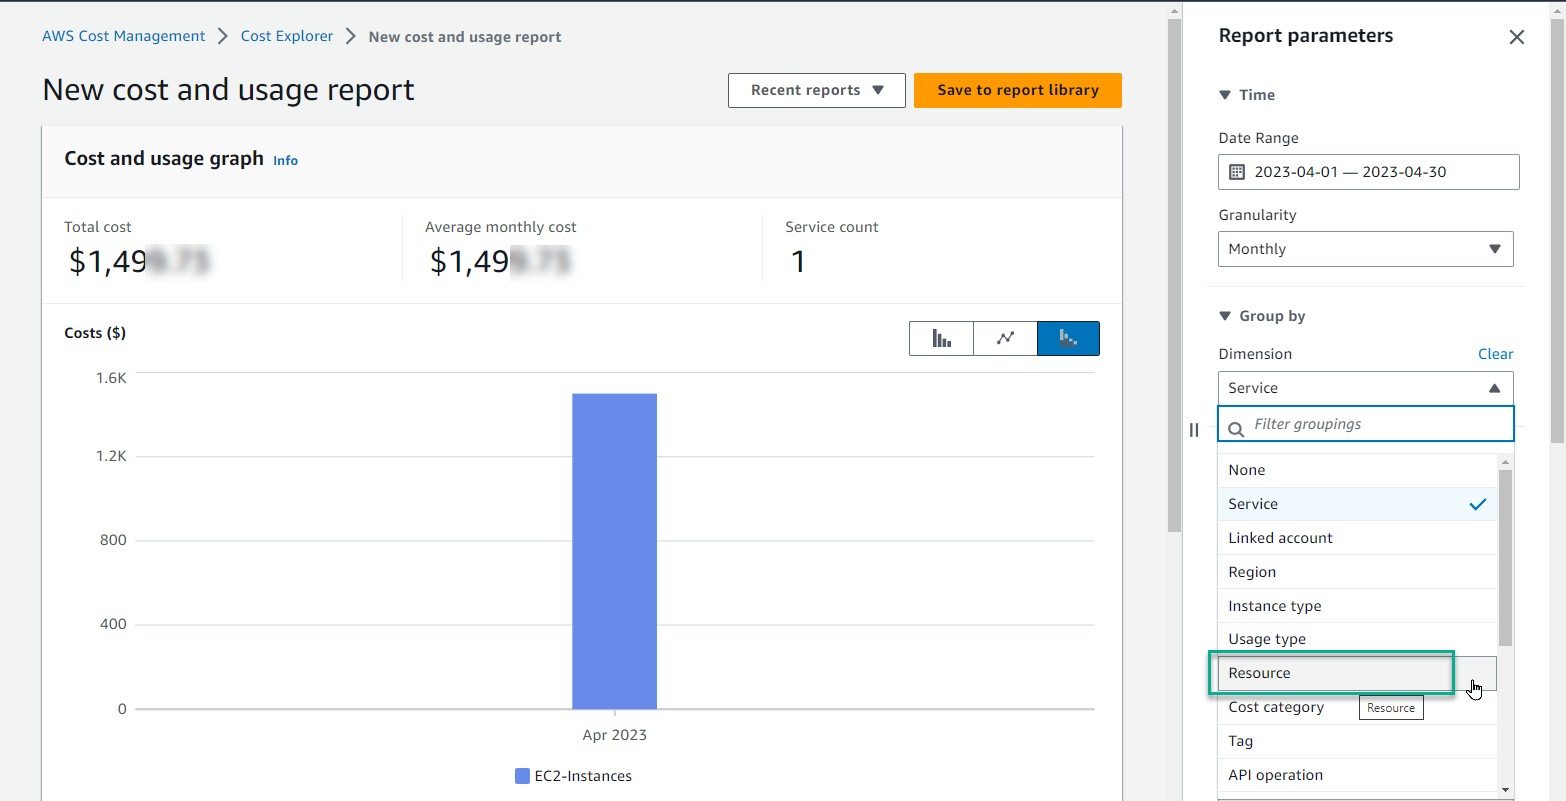
But, you need to know the cost details for each EC2 - Instance ID. So, in the Dimension section, select Resource
-> You will receive the following message, if the 14 day rule is exceeded.
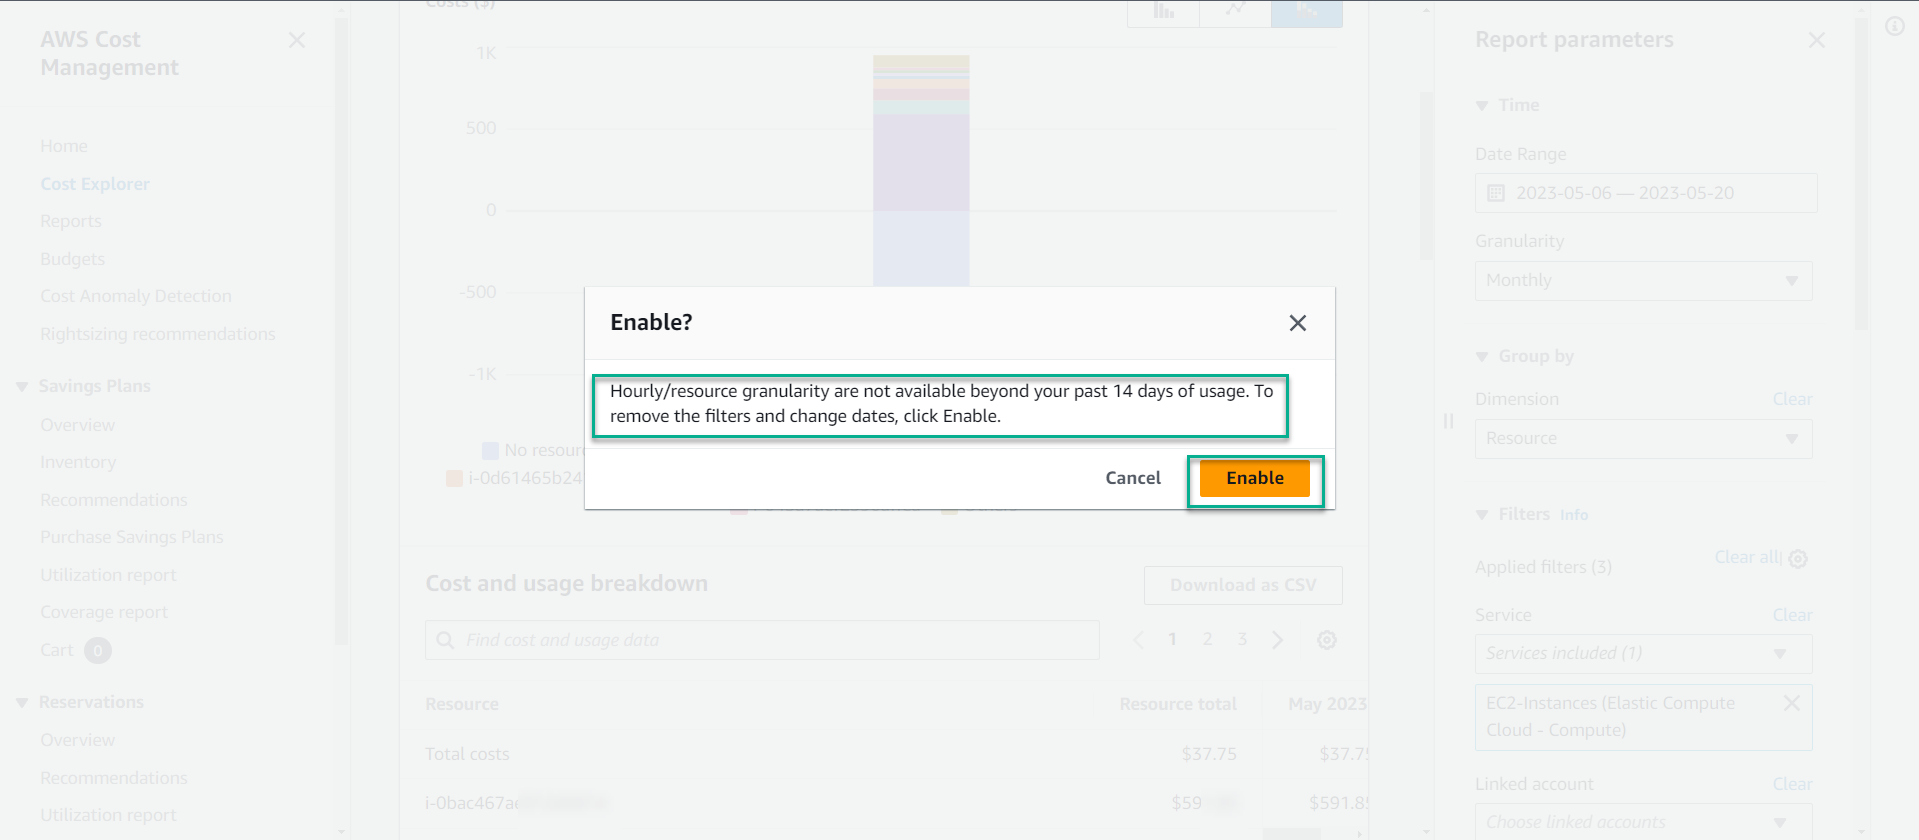
You just need to select Enable, AWS Cost Explorer will automatically convert the data analysis time to the last 14 days.
Scroll down, you will have a detailed list of costs by each EC2 - Instance ID, you can choose to download to track expenses in your personal computer with CSV file
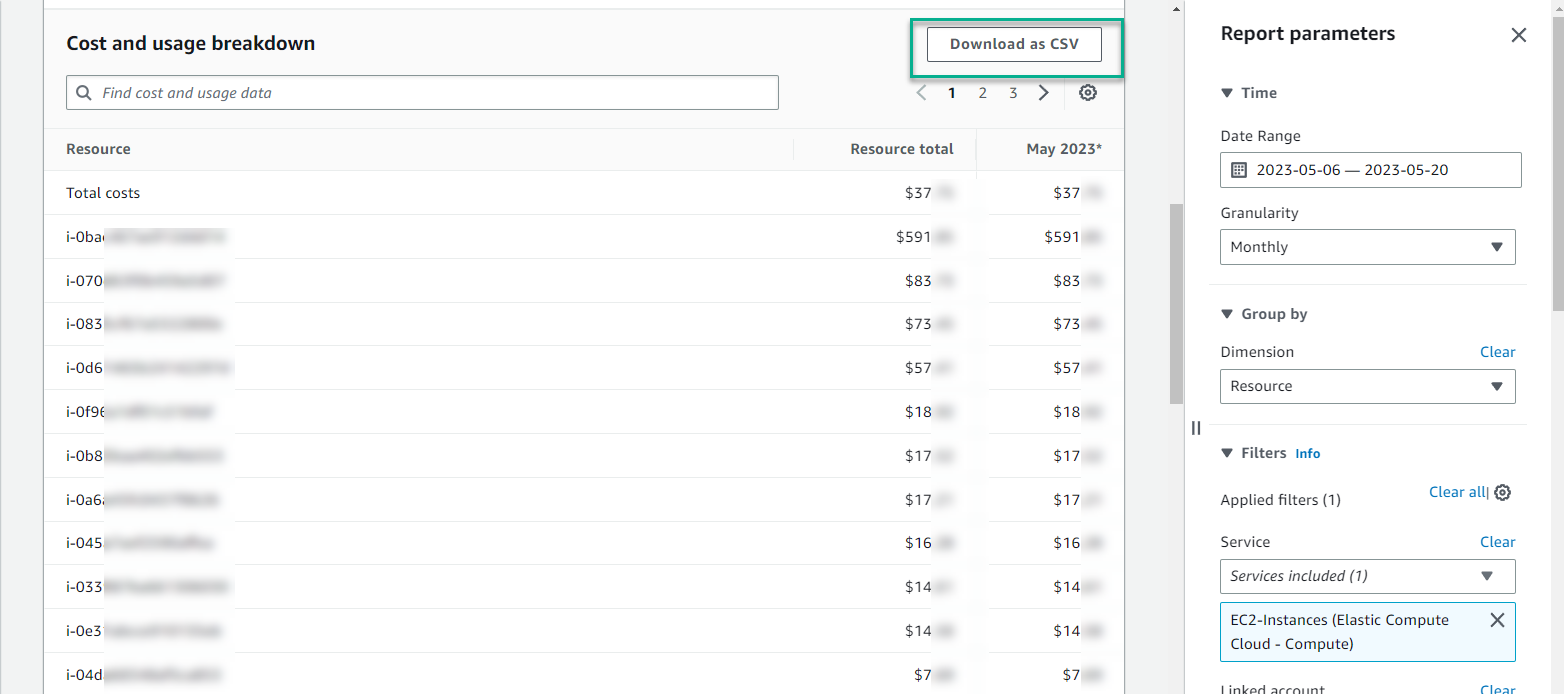
=> In fact, each EC2 can take on a different task, specific reports help you plan the optimal cost of your resources with the unique needs of your business.
2. Cost Explorer helps you track expenses by “tag”
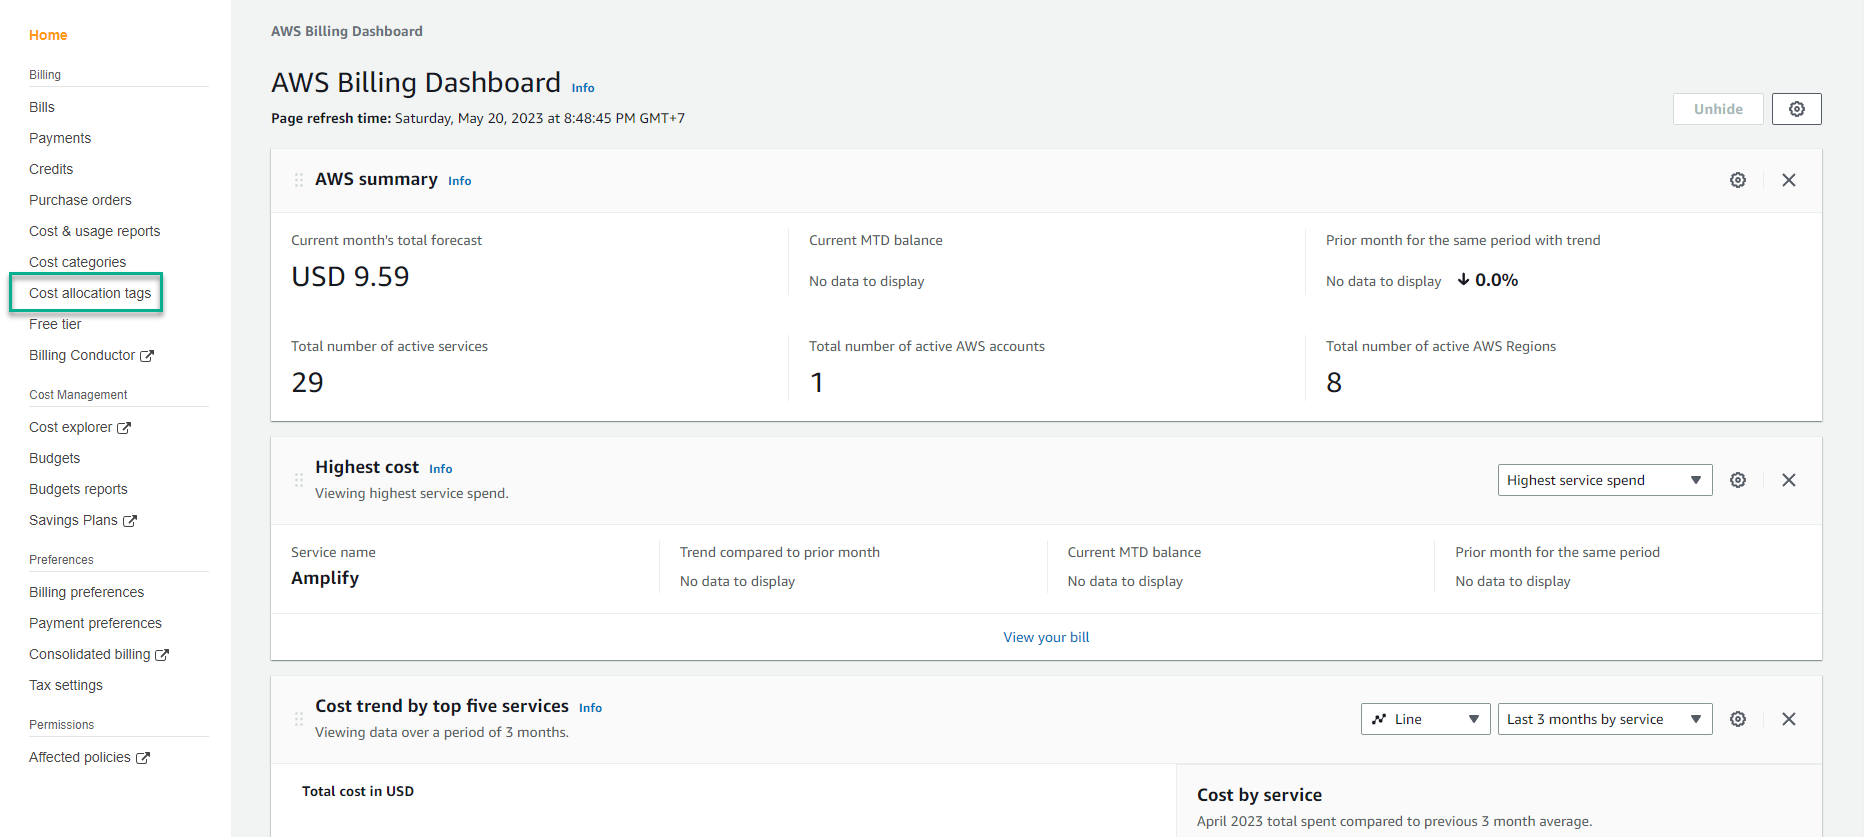
Besides, if you have practiced lesson 27: MANAGE YOUR RESOURCES WITH TAGs AND RESOURCE GROUPS and apply it to your AWS system, you will Analyze costs by tag with AWS Cost Explorer, but you need to enable cost allocation tags function.
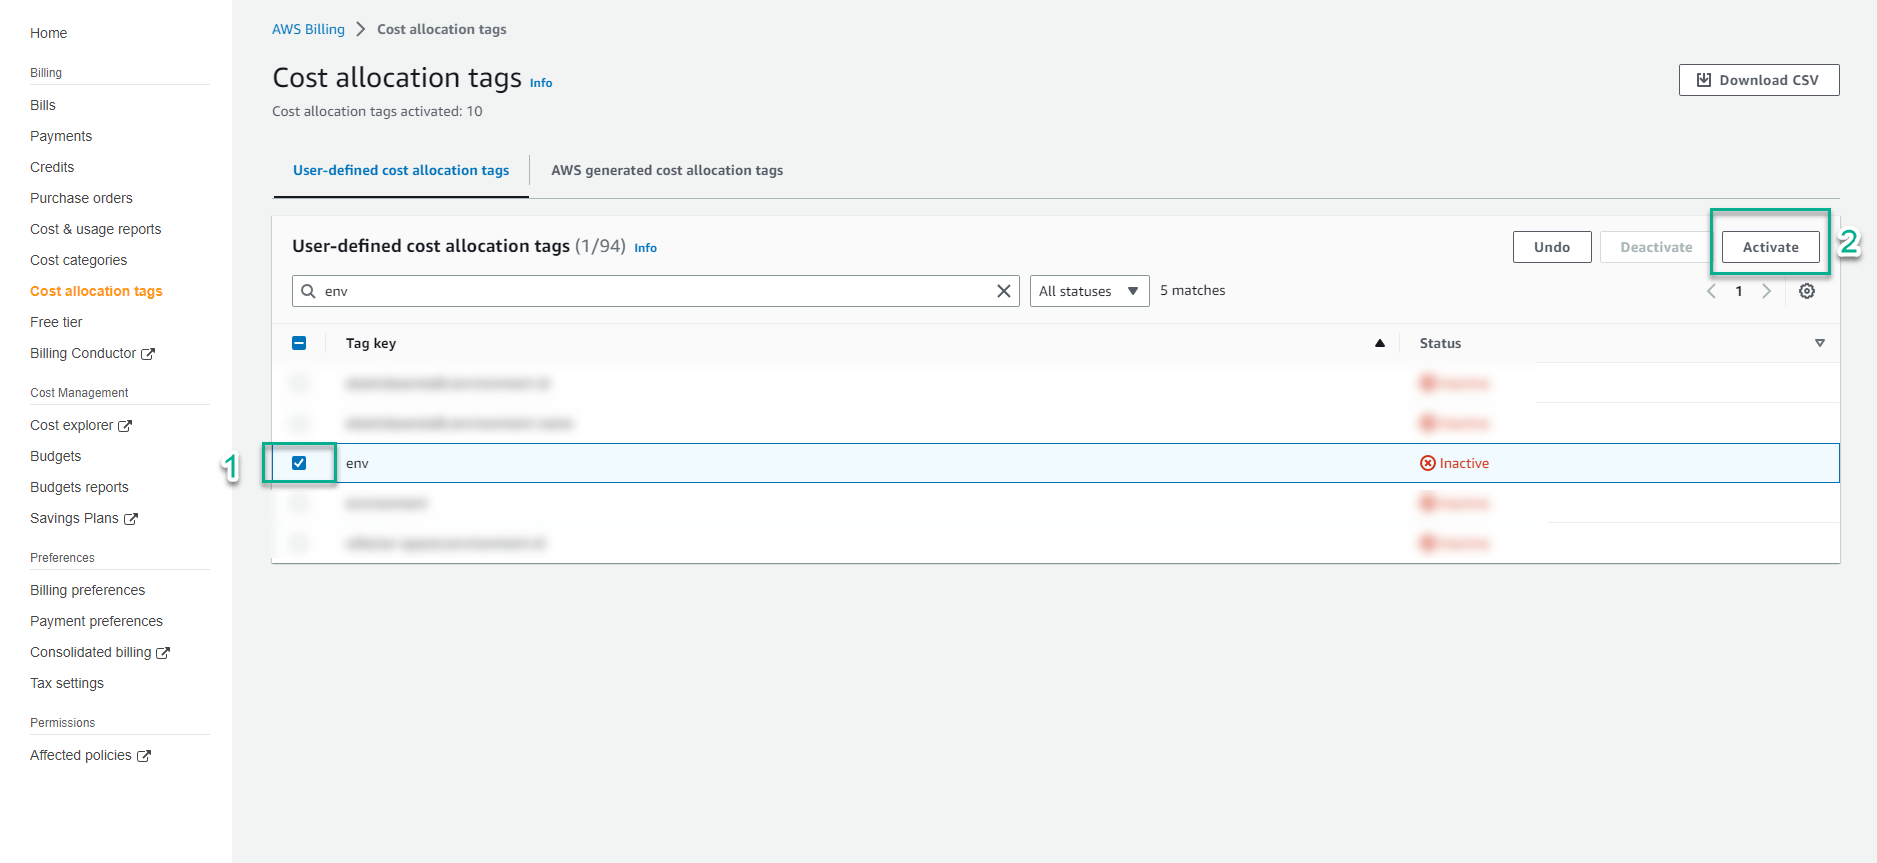
At Billing transaction, left hand side - select cost allocation tags
For example, in my AWS account currently there are resources with tag key as Env (short for Environment), with status Inactive
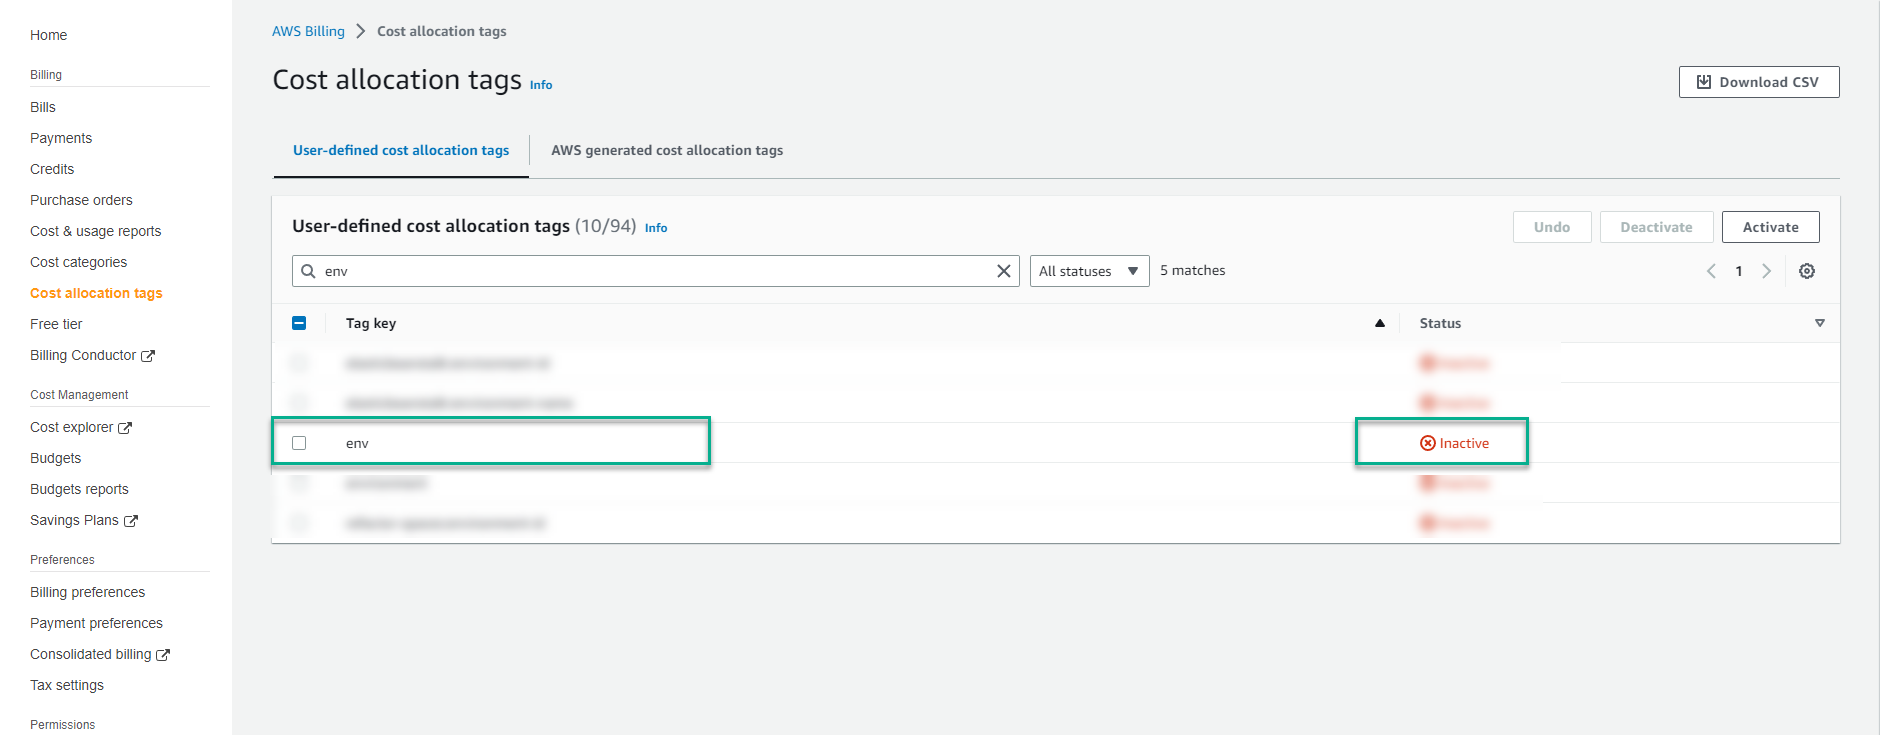
Check the box icon at the top position tag key and select Active
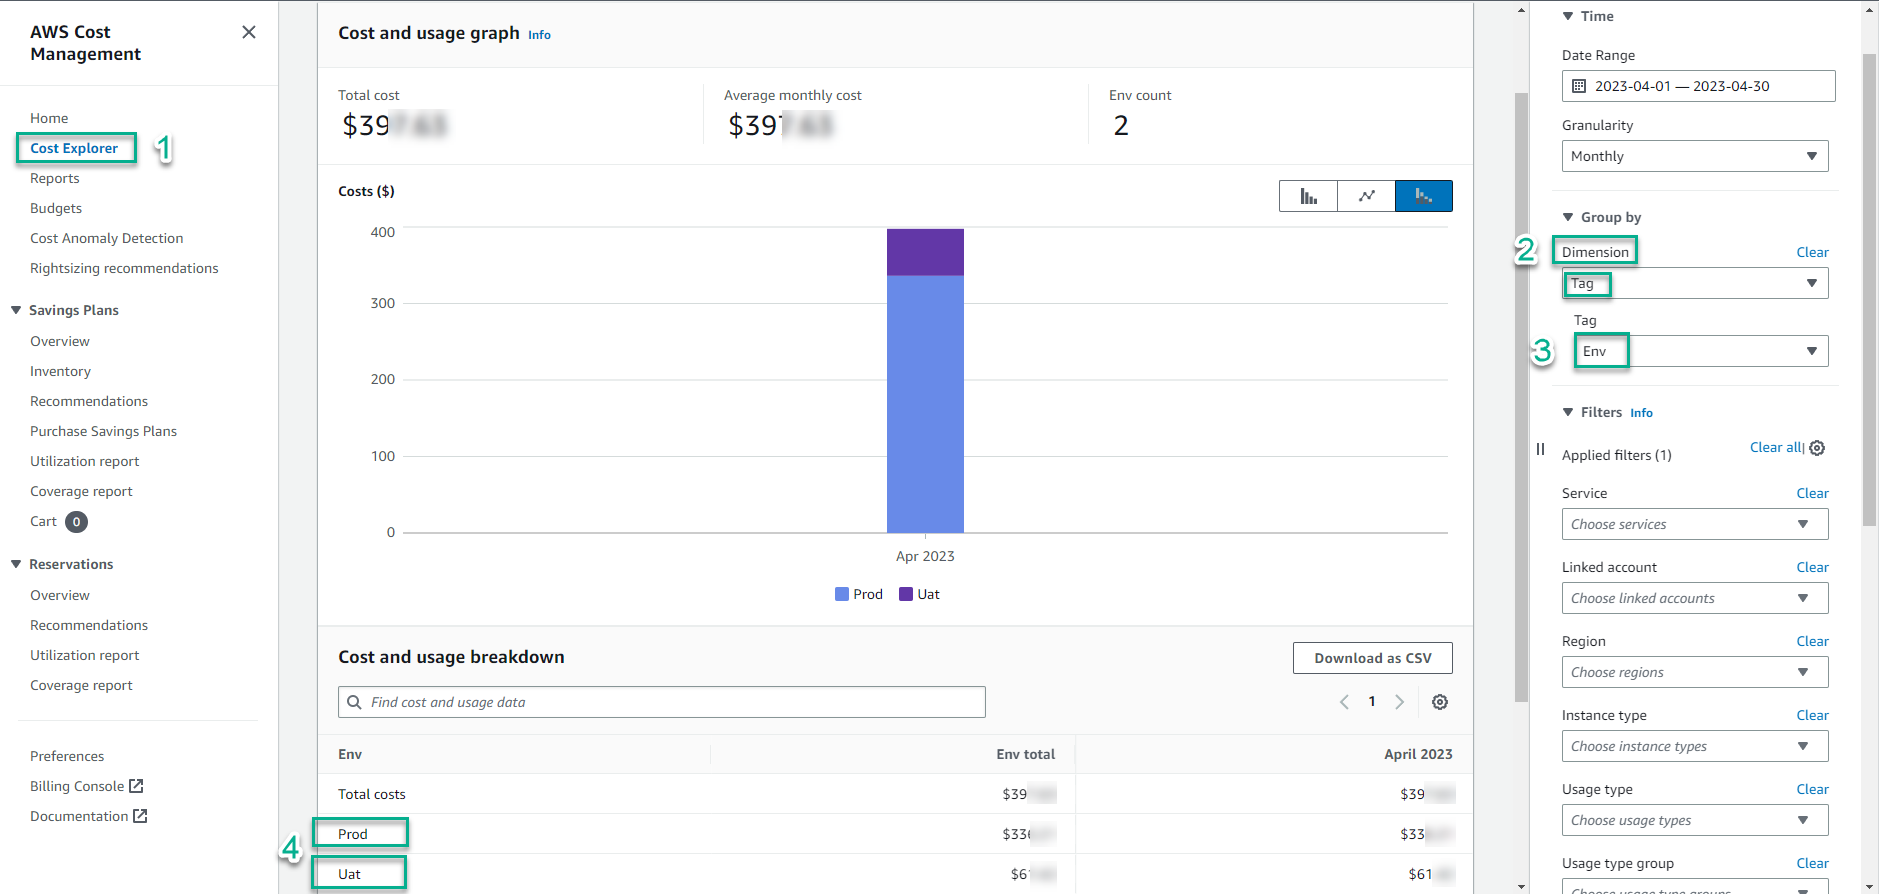
Return to Cost Explorer interface and filter Dimesnion -> Tag -> Env. You get the result of the cost of the environment that you tagged for each resource before: Prod & Uat
3. Cost of using Cost Explorer
Using Cost Explorer on the AWS console directly to review cost and usage AWS no charge ($0.00) for this However, from the perspective of finance and business teams, you will need to be more intuitive about the cost, now you will use the BI tool to api call to directly access and interact with AWS Cost Explorer . And each request will have a fee of $0.01 In addition, the resource level granularity analysis, with 1000 Usage Records will cost $0.01
4. Cost Explorer helps you track “Data transfer out” expenses
By doing the labs:
- 03 - Deploy network infrastructure with Amazon Virtual Private Cloud
- 57 - Hosting static website with Amazon S3 and other labs
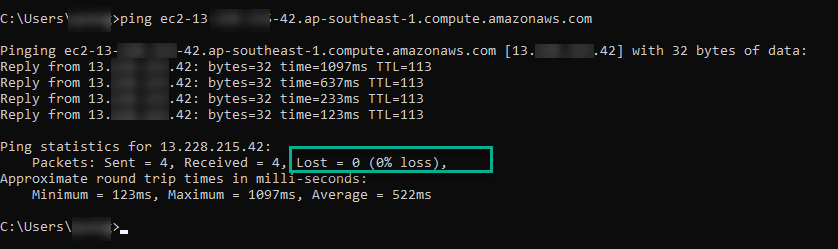
During EC2 availability check with ping command from your local machine - EC2 returned the following successful result:
Or a travel website hosted on S3, tested for effectiveness right on your own browser as shown below:
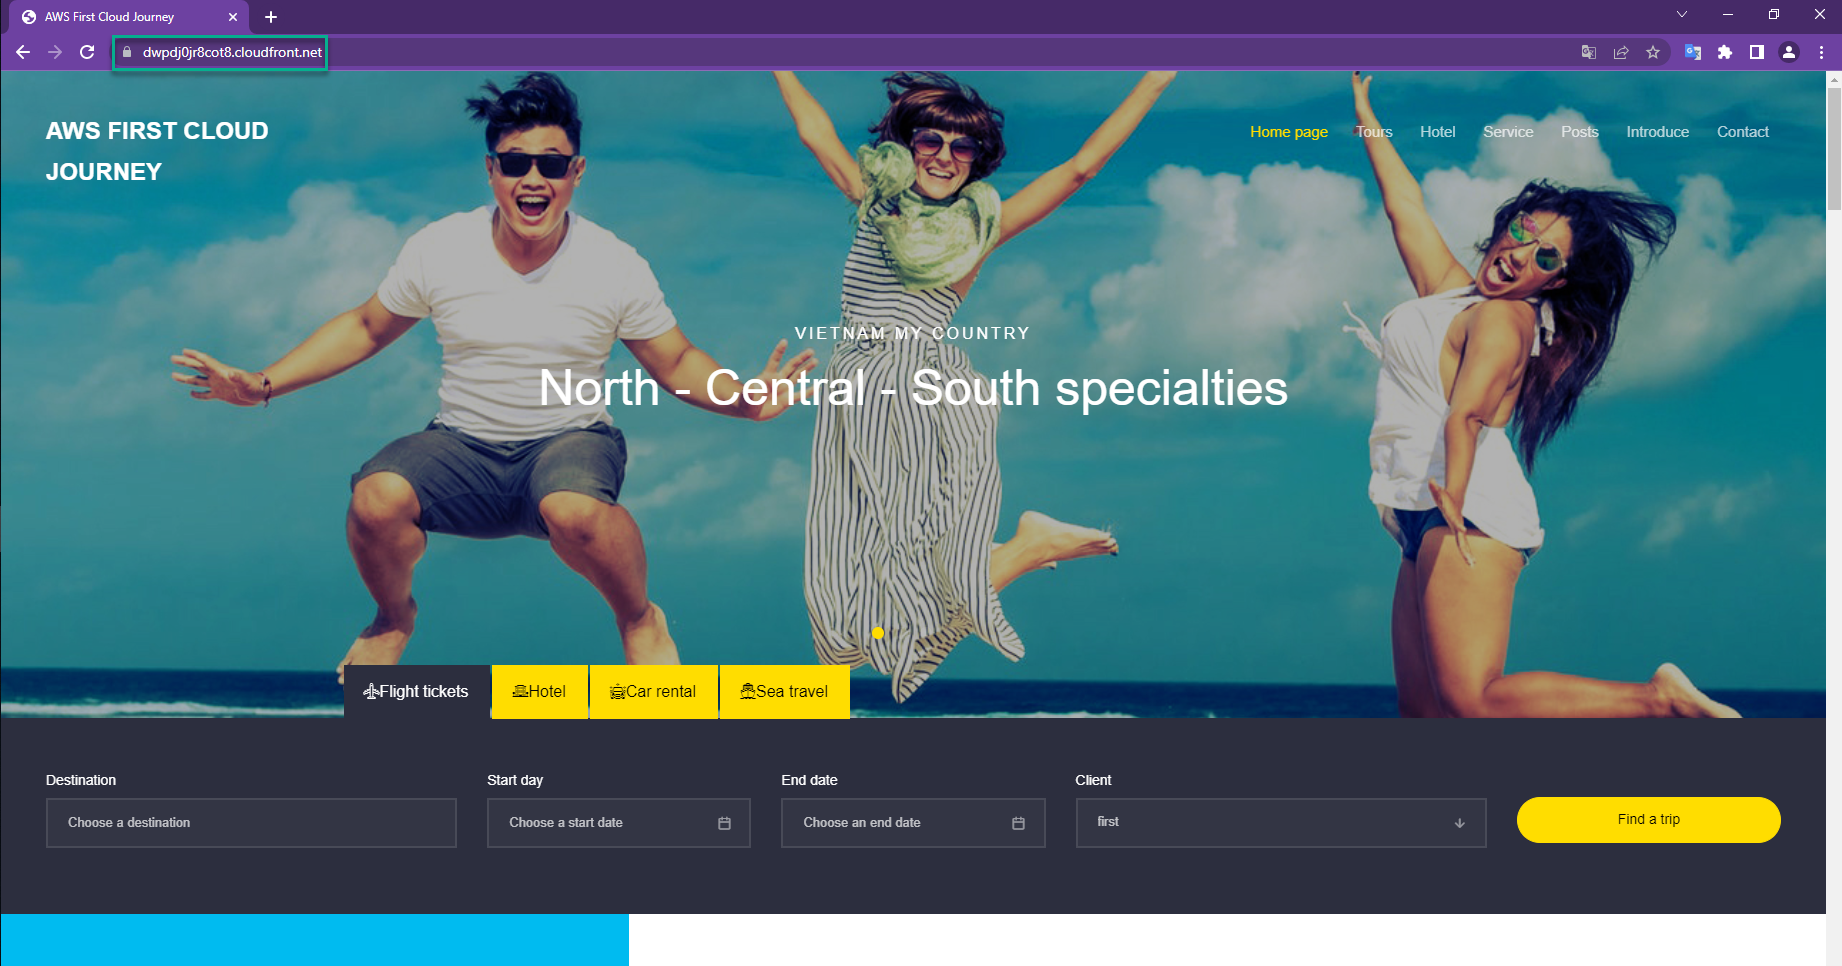
-> All have the same action: send request to your AWS service and the server will return a data -> it’s means EC2 or S3 returns some amount of data & this amount of data has gone out of your Region AWS - this will result in a fee called data transfer out. ->However, when you upload the source code to S3 to host a static web, this update means that your server is sending an amount of data to the AWS S3 service - this no costs is called data transfer in ->So, with data transfer operation, you need to understand how the configuration will be called data transfer out by AWS to recognize and optimize this type of cost! And Cost Explorer will help you track data transfer out costs by service.
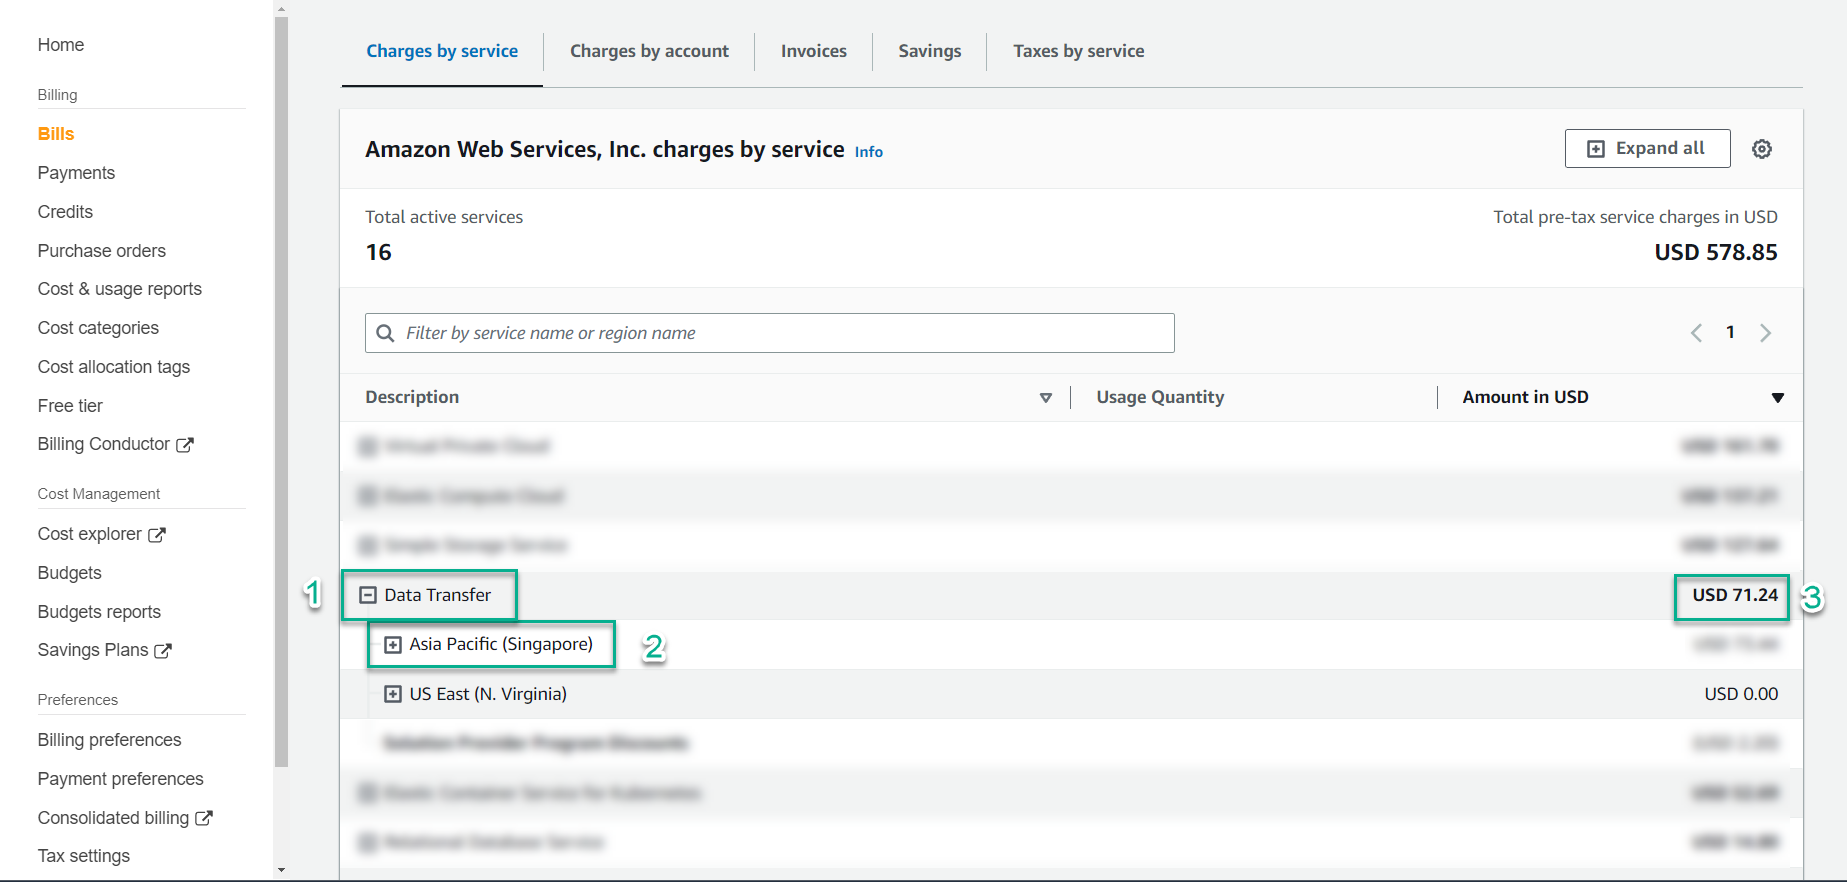
Example: In Billing interface, you see that Data Transfer service in Singapore region is costing USD 71.24
Note: completing the above 2 labs may not incur data transfer out costs because the amount of resources generated from the workload is still within the AWS free tier policy
- Data Transfer from AWS Regions to the Internet is now free for up to 100 GB of data per month (up from 1 GB per region). This includes Amazon EC2, Amazon S3, Elastic Load Balancing, and so forth.
- Data Transfer from Amazon CloudFront is now free for up to 1 TB of data per month (up from 50 GB)
In the Cost Explorer interface, continue filtering to see which services this Data Transfer cost comes from
- Dimension : Service
- Usage type group : in the search box, enter
Data Transfer, scroll down and check all matching values: Data Transfer and Out. Note: because we use EC2 service, choose EC2: Data Transfer - Inter AZ => select Apply - Show all : select to see the system check has recorded the set value -> results in the small box next to the left
- On the left, the Service column: shows the service with a cost data transfer out analyzed by the amount of GB used and the corresponding USD cost
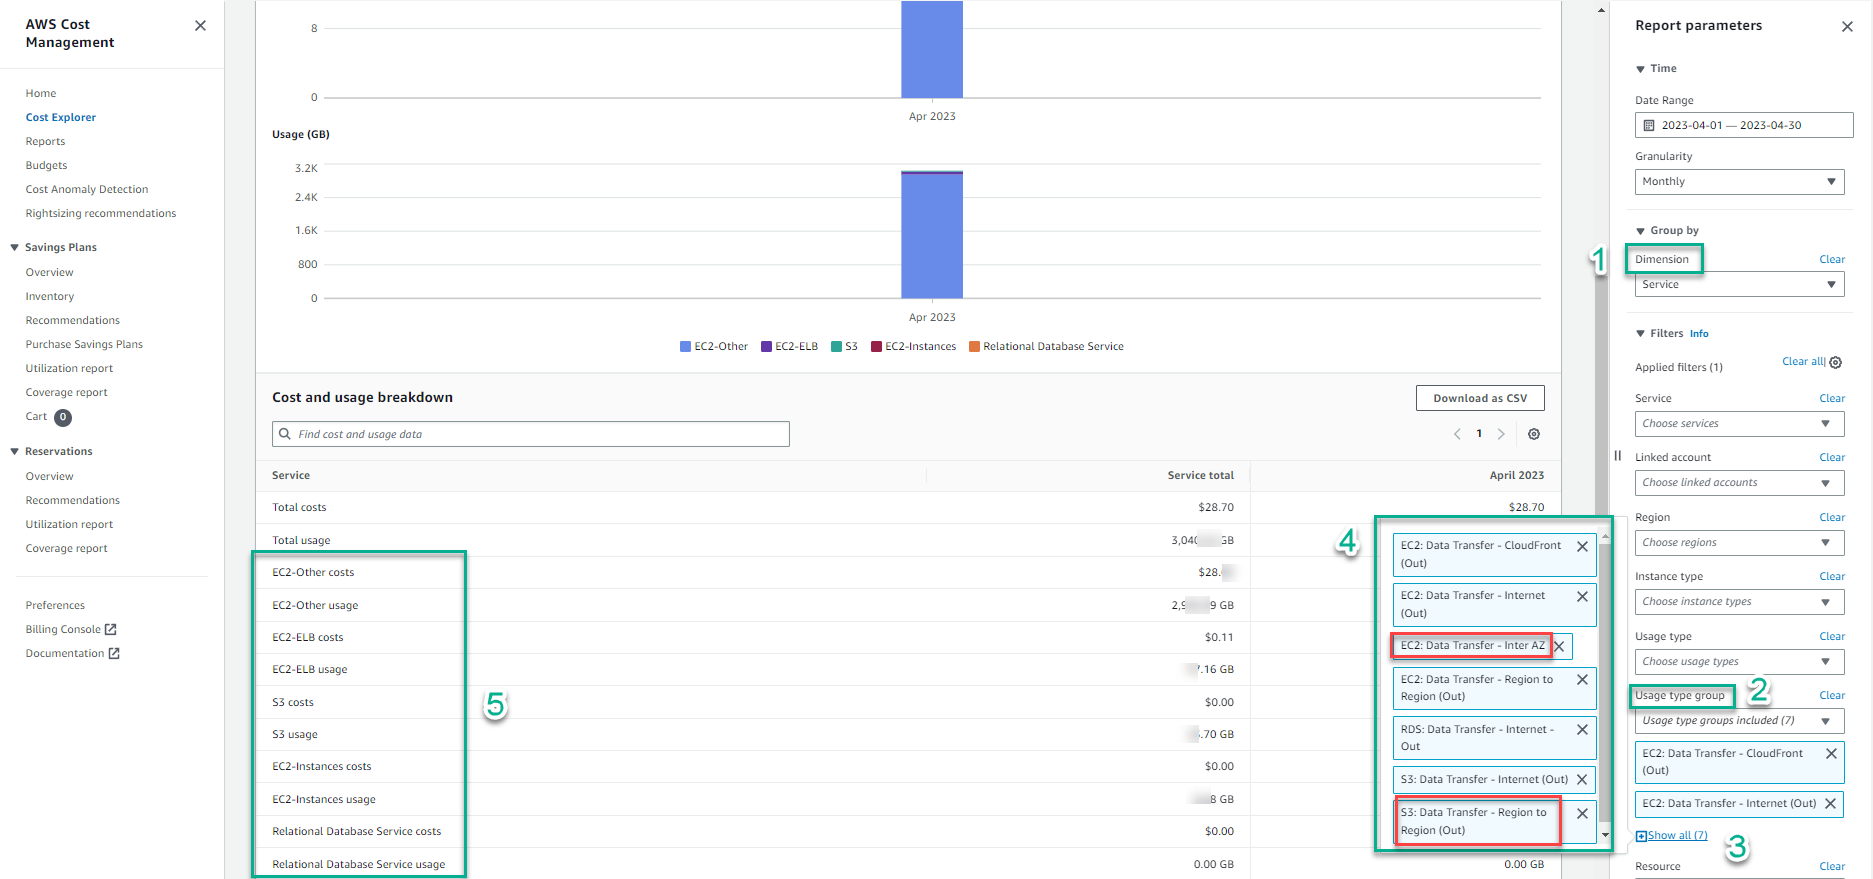
Note: in the two red frames, show the value:
- Cost of S3 with data transfer out Region to Region operation
- EC2 cost for data transfer out Inter AZ
=> So what do the two concepts in italics above mean, and are there other configuration operations that contribute to the cost of data transfer out? Let’s find out in step 8.